
So far I've looked at the biochemistry behind thresholds, and evidence for whether thresholds exist (it appears they do, but not the one we all call 'threshold'!). For this post I'm going to look at some of the ways that we have tried to describe our thresholds and limits.
The aim of a mathematical model is to make predictions - in this case, usually cycling performance as it's easier to measure due to power meters etc. If a rider wants to know how hard they should be able to go for an hour in a race then, rather than the stress of testing for an hour beforehand, they might use a model based on their maximum efforts over shorter distances.

The aim of most of these models, then, is to produce a curve which can predict the "best effort" speed, or power over a variety of time periods. Above is a graph of best efforts taken from real rides; obviously not every point represents a maximum effort - but ideally when generating a model we should pick out the "most impressive" points from the graph to produce our figures. You might recognise the graph as similar to the World Record running speed graph from a previous post - and they are analogous except that this graph is produced from a single individual.
In this post I'll be going through a few models of different types (necessarily not all!) and noting how well they seem to correspond to the real world
Single-variable
eg FTP, VDOTThese are the simplest models, and potentially full of flaws - but despite their caveats we use them gleefully anyway. FTP is everywhere in cycling, and VDOT for runners - and they're very useful concepts but we must be very cautious not to extrapolate. The basic idea is to have a standard-shaped curve, which is then scaled to the single variable (FTP or VDOT) being used. However, it predicts that runners who finish a 400m together will cross the line together in a marathon too - ignoring the difference between "speed demons" and "diesel engines" that makes the sport more interesting.
In cycling, the rise of TrainerRoad and Zwift - along with "smart trainers" have made everything about the FTP (though in Zwift it's usually indexed to weight). An interval session might target 120% of FTP for the 'on' - and it's the same for everyone even though some will find it easier than others. I've discussed previously my concerns about FTP (primarily that there's no "threshold" there), but overall I think it's a useful concept - and the simplicity helps.
Testing for the single-variable models varies, but just needs a single maximum effort. For cyclists that usually means a 20-minute max and taking 95% of the average power.
Two-variable
Anaerobic Capacity
eg Monod/Scherrer (CP, W')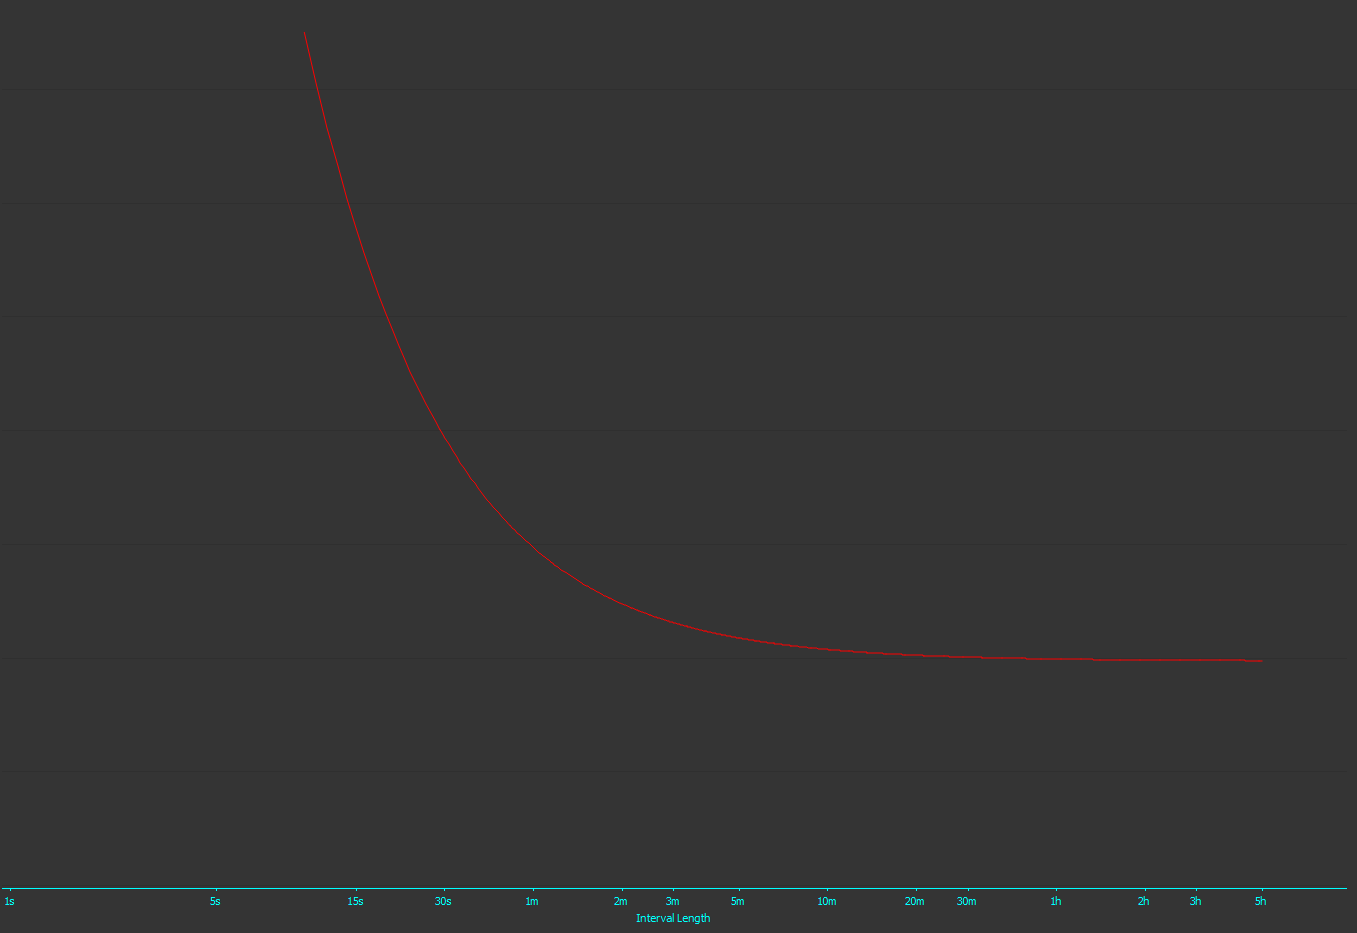
The first of the 'proper models' (ie attempting to generate a curve from athlete data rather than using standard curves) comes from Monod and Scherrer in 1965. Their "Critical Power" underpins most models produced since - though it has been subject to some confusion with people using terms like "CP60" to mean a 60-minute best effort. In this model, CP is the asymptote on the right - a power that could in theory be sustained indefinitely.
Their model has two components - CP, representing sustainable but limited power production, and W' (sometimes known as AWC/Anaerobic Work Capacity) - a short-term "battery" that can be called upon for harder efforts. The W' battery can be used slowly, spread as a small power increase over an hour, or quickly as a massive surge released over a minute - but when it is used up then only the CP remains.
The model stands up fairly well over periods of about 1-40 minutes, but breaks down badly for shorter and longer periods. There is no limit on how quickly the W' "battery" can be released, so as the period gets shorter the predicted power heads to infinity which is clearly nonsense. And for longer intervals, it predicts that any power at or below CP can be sustained indefinitely.
To produce figures for the Monod/Scherrer model, tests over two time periods are needed - usually about 4 and 20 minutes. Taking P20 and P4 as the average power over the two time periods (I've left the equation unsimplified so you can use different time periods if you want):
W' = (P4-P20) / (20*60 - 4*60)
CP = P20 - W' / (20*60)
To clear up confusion, FTP (maximum sustained power for 60 minutes) is not the same as CP - in this model FTP is slightly higher (by about 5W for someone with a W' of 20kJ) due to the W' being spread across the 60 minute period.Fatigue
eg Riegel
 Riegel's 1981 paper was looking at world records for swimming, cycling and running (along with skating and human-powered flight!) as he tried to find a 'best-fit' equation to describe the maximum speed humans could manage over each distance. He took logarithms of both sides of a time/distance graph of world records and noted that the result appeared to be a straight line (I've done the same with the data from my second thresholds post, to the right). From this he deduced his "t=axb" formula - often known as the "Runner's World" formula when b=1.06 (which then makes it single-variable).
This can also be used for cycling - he originally described it with speed, but various calculators have used it with power (I've put an example on the right). As you can see, the left end is plainly inaccurate - it doesn't account for any kind of anaerobic sprint or surge, but on the right it shows fatigue and the fact people do get slower when competing for several hours.
Again, I think this model has its uses, though it's obviously very different to Monod/Scherrer. I am suspicious though - taking the log of both sides is a very good way to wipe out significant variations in speed. I explored this in a previous post - it's plainly not just a simple curve. However, for making brief estimates of eg marathon time from half-marathon performance, it's probably not too bad.
Three-variable
eg Morton (CP/W'/Pmax), Ward-Smith
The Monod/Scherrer model fails for both long and short distances; Morton in 1996 sought to correct the latter failure by adding in a maximum power term to prevent the problems with predictions of massive power over short durations. This term is "Pmax" and can be tested as your absolute peak power over a single second during an "all-out" interval.
Interestingly, Morton's model predicts that the amount of an athlete's Pmax they are capable of producing is proportional to the amount of W' they have left at any instant - thus putting some figures on that lovely drop-off that occurs whenever I try Wingate intervals.
This model definitely improves accuracy at the short end (under a minute); however it has other side effects (which Morton argues are a good thing) - it generally predicts a higher W', and consequently lower CP than the Monod/Scherrer model.
The Ward-Smith model is similar, though formulated from the bottom-up by a consideration of physiology in runners.
Four-or-more-variable
Various - generally CP/W'/Pmax/Fatigue)
The two variable models can be simply calculated by hand; even three is just about possible. But computers make it very easy to throw maths at a situation, and unfortunately it is true that with enough variables you can generate a curve to fit any data points you like. However, clearly there are limitations even with the three-variable models when it comes to longer distances. In general they predict that the same power which can be sustained for an hour can be sustained for two or more hours; a prediction that any long-distance racer would counter.
The model I'm familiar with (because it's in the excellent Golden Cheetah) is Damien Grauser's, which is based on further publications by Morton (specifically his excellent 2006 paper where he takes "referring to yourself in the third person" to new levels). Other models exist (eg some from Veloclinic), but I have trouble getting them to match my curve. Grauser's model adds three energy systems together (phosphate, glycolysis, oxidative); each has a maximum output, response time and decay. Golden Cheetah leaves some of these variables fixed, and others it determines from scanning for 5 "best efforts" across a range from 1 second to several hours.
It's plain that it fits the data well, though with enough variables it is always possible to get a close match for raw data. The key question of its value is whether the model's components turn out to be of any use - eg CP which has already been widely accepted, and W' which is now being tracked live by some cyclists to predict how hard and how long they can 'push' during a race. I for one would be very interested in some kind of long-distance 'fatigue' metric to target with training - and wait to see if any of these newer models are formally published and tested.
Real-world complexity
The models above describe constant maximal efforts; possibly of use in time trials or for planning interval training, but not so valuable in the real world where power output varies. In a future post I'll look at models designed to deal with that such as Coggan's Normalised Power and Skiba's W'bal.Further reading
- Monod H, Scherrer J. THE WORK CAPACITY OF A SYNERGIC MUSCULAR GROUP. Ergonomics. 1965 Jul;8(3):329–38.
- Riegel PS. Athletic Records and Human Endurance. American Scientist. 1981;69(3):285–90.
- Ward-Smith AJ. A mathematical theory of running, based on the first law of thermodynamics, and its application to the performance of world-class athletes. Journal of biomechanics. 1985;18(5):337–349.
- Morton RH. A 3-parameter critical power model. Ergonomics. 1996 Mar;39(4):611–9.
- Morton RH. The critical power and related whole-body bioenergetic models. European Journal of Applied Physiology. 2006 Mar;96(4):339–54.
- https://twitter.com/grauser/status/417056955451318273
- http://veloclinic.com/wp-content/uploads/2014/04/PowerModelDerivation-1.pdf
No comments:
Post a Comment